Português
English
Português |
English |
Our main goal is to create an environment dedicated to image processing, computer graphics and computer vision applied to images from different fields of experimental Physics.
Aplications:
The study of several patterns
from different fields of physics requires many observations techniques.
Image Processing, Image Analysis and Computer Vision plays an important
role in the quantitative analysis of such patterns and in the interpretation
of their spatial arrangements. In this project we are interested in different
images from different kind of systems : cellular structures, bubble patterns,
fiber structures, etc. The main image analysis are : grain and topological
analysis, densitometry, pattern recognition, and many other that are system
dependent. Patterns came for example from magnetic-films (magneto-optical
observations of magnetics
domains), metalurgy, numeric simulations, x-ray difraction, atomic-force
microscopy, etc.
|
|
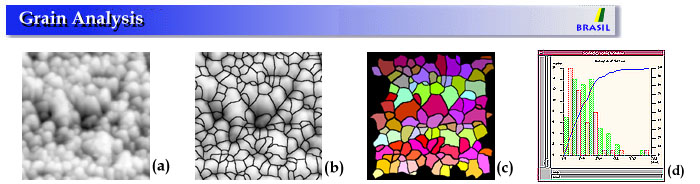
Edge detection of a grain structure: (a) Original Image of a FLi film (image from a atomic force microscope (AFM), of a FLi film - from A.O.Caride/CBPF). (b) Image after segmentation. The segmentation was done using mathematical morphology techniques (dilation followed by a watershed algorithm). Both images are superposed for best view. (c) Grain are individualized and labeled. Border grains are eliminated from the final image. (d) Histogram of area distribution function of the original image.
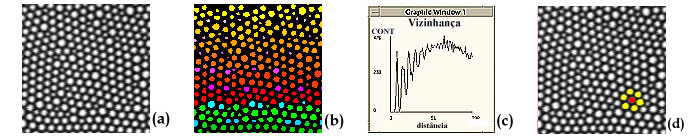
Neighbor
Analysis of a cellular structure: (a) Original image with an hexagonal
organization of a magnetic
bubble structure. (b) Image after a segmentation in different regions.
In the image a label (color) is affected to each cell. There are no correlations
between this colors. (c) Histogram of the Radial Distribution Function
of the distances between cells. Using this technique one can show peaks
of first, second, third, ... neighbors of the cellular structure. (d) Detection
of on cell in red and its6 neighbors in yellow.
Last changes: